Histograms
Histograms are very similar to a bar chart in many ways, they look the same in terms of the way they are laid out and in terms of the axis. But instead of using specific numbers they use ranges. Up the left axis you would put how many times this has happened. For example, if you are measuring the length of tables in a village in NSW.
If you had:
1.90m, 1.50m, 1.62m, 1.70m, 2.14m,1.23m and 1.98m
You can decide what range you have. This could vary from every 5cms to every 50cms.
If you did 5cm then you would do from 1.20m to 2.15m. It would look like this:
If you had:
1.90m, 1.50m, 1.62m, 1.70m, 2.14m,1.23m and 1.98m
You can decide what range you have. This could vary from every 5cms to every 50cms.
If you did 5cm then you would do from 1.20m to 2.15m. It would look like this:
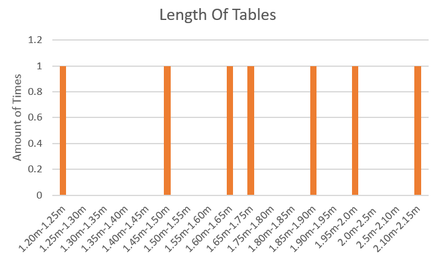
(Even if there are places with 0 in it you still keep the gap in)
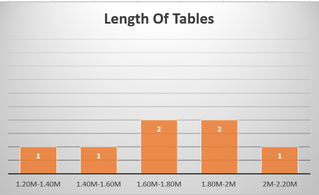
Of course, this is very impractical, it would mean that there are lots of ranges and this can be very annoying to write out, a better version would be doing it every 10cm or 20cm.
This is what 20cm would look like:
Polygons
Polygons are a type of shape that can generally be found on a radar chart and maps. They have a series of criteria that makes it a polygon:
1. It must be a closed shape.
2. It can be defined by a series of x,y coordinates.
3. The first and last point fall on the same coordinate.
4. No other corner of the shape are of the same point.
5. There are no curves in the shape.
Irregular polygons are shapes that have unequal sides, but a regular would be a pentagon or other enclosed shape that has no curves.
