Line Graphs
Line graphs are a useful format for many types of data, for example, it can be used for statistical data, the evolution or stages for something or the times when there is most activity in the store.
In statistical data it can show at what age certain people like certain things, this can be useful for some businesses as they might rely on certain age groups. For example, certain to shops are for smaller kids, things like stuffed toys and small building blocks. Other shops might have nerf guns and remote controlled drones. These types of shops will rely on 12-16yr olds to make a sizeable profit.
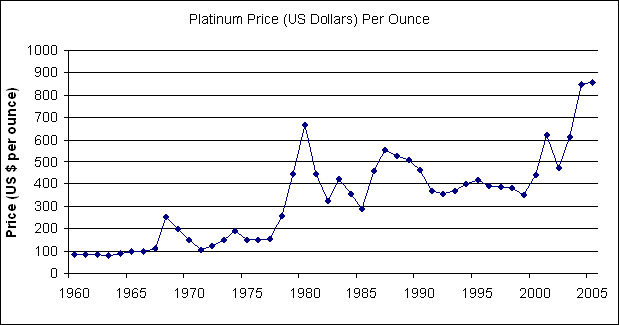
The line graph can also represent the evolution or changing of something. They can emphasize the smallest movement or change in a set of numerical data over time. It can show rapid upward or downward movement. It can show when things start to move faster or slower and when the data is following a certain trend.
In statistical data it can show at what age certain people like certain things, this can be useful for some businesses as they might rely on certain age groups. For example, certain to shops are for smaller kids, things like stuffed toys and small building blocks. Other shops might have nerf guns and remote controlled drones. These types of shops will rely on 12-16yr olds to make a sizeable profit.
The line graph can also represent the evolution or changing of something. They can emphasize the smallest movement or change in a set of numerical data over time. It can show rapid upward or downward movement. It can show when things start to move faster or slower and when the data is following a certain trend.